Cloudflare DDoS Threat Report - 2025 Q1
The 21st edition of the Cloudflare DDoS Threat Report, offering a comprehensive analysis of the evolving threat landscape of Distributed Denial of Service (DDoS) attacks based on data from the Cloudflare network.
Welcome to the 21st edition of the Cloudflare DDoS Threat Report. Published quarterly, this report offers a comprehensive analysis of the evolving threat landscape of Distributed Denial of Service (DDoS) attacks based on data from the Cloudflare network. In this edition, we focus on the first quarter of 2025.
While this report primarily focuses on 2025 Q1, it also includes late-breaking data from a hyper-volumetric DDoS campaign observed in April 2025, featuring some of the largest attacks ever publicly disclosed.
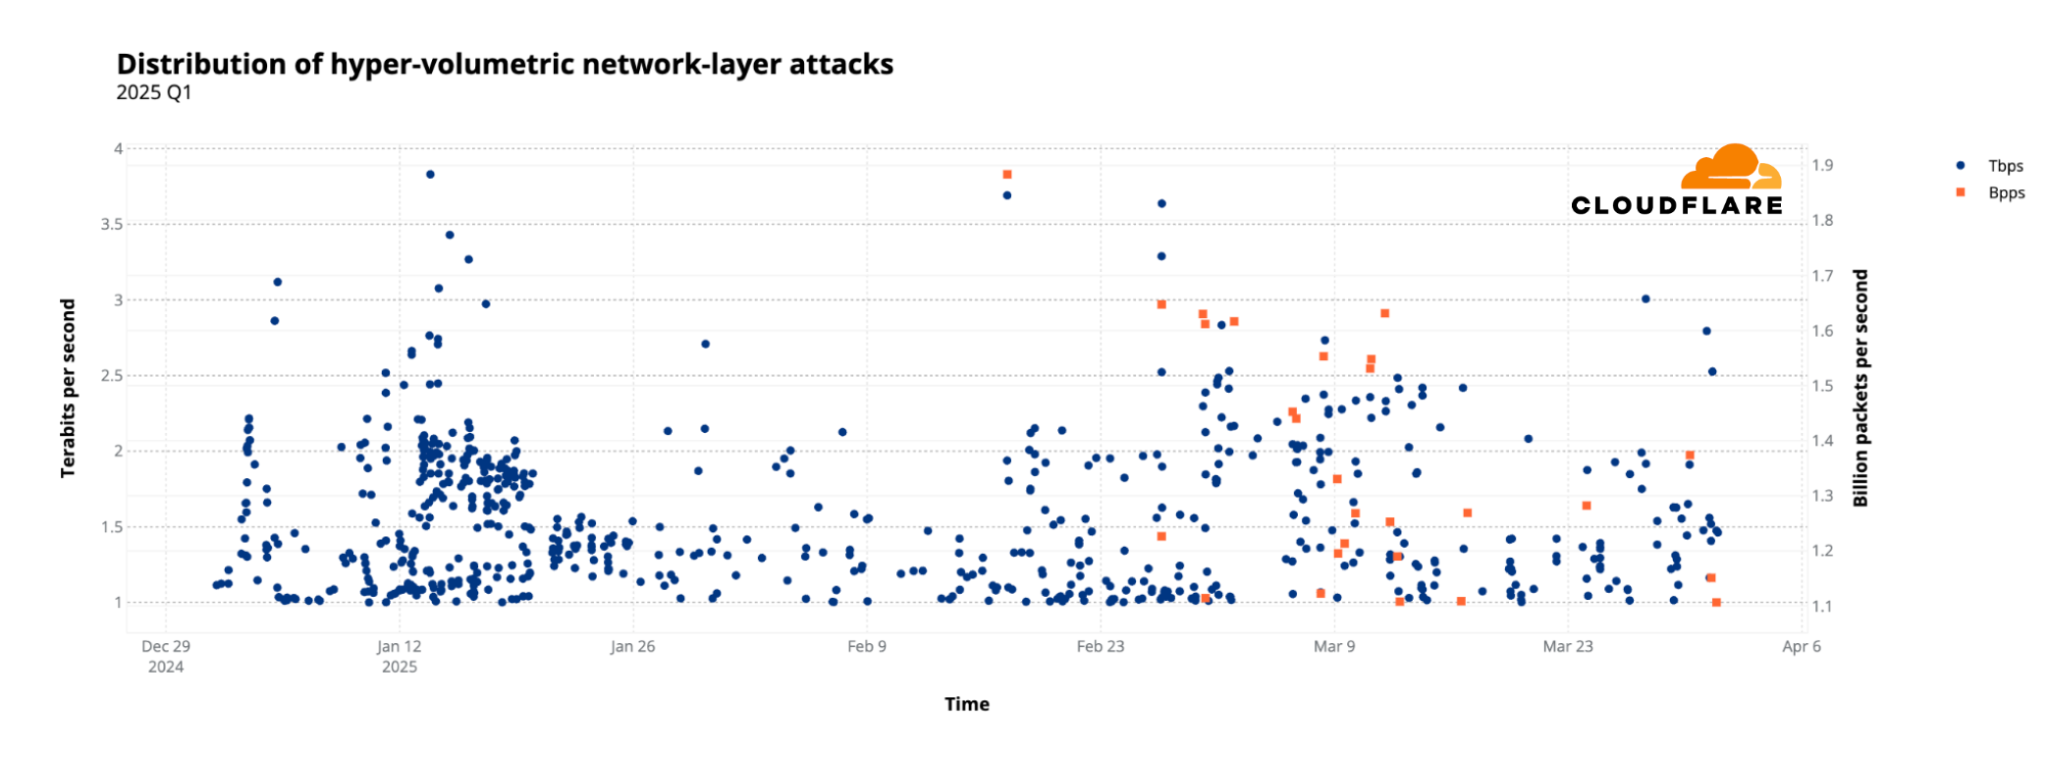
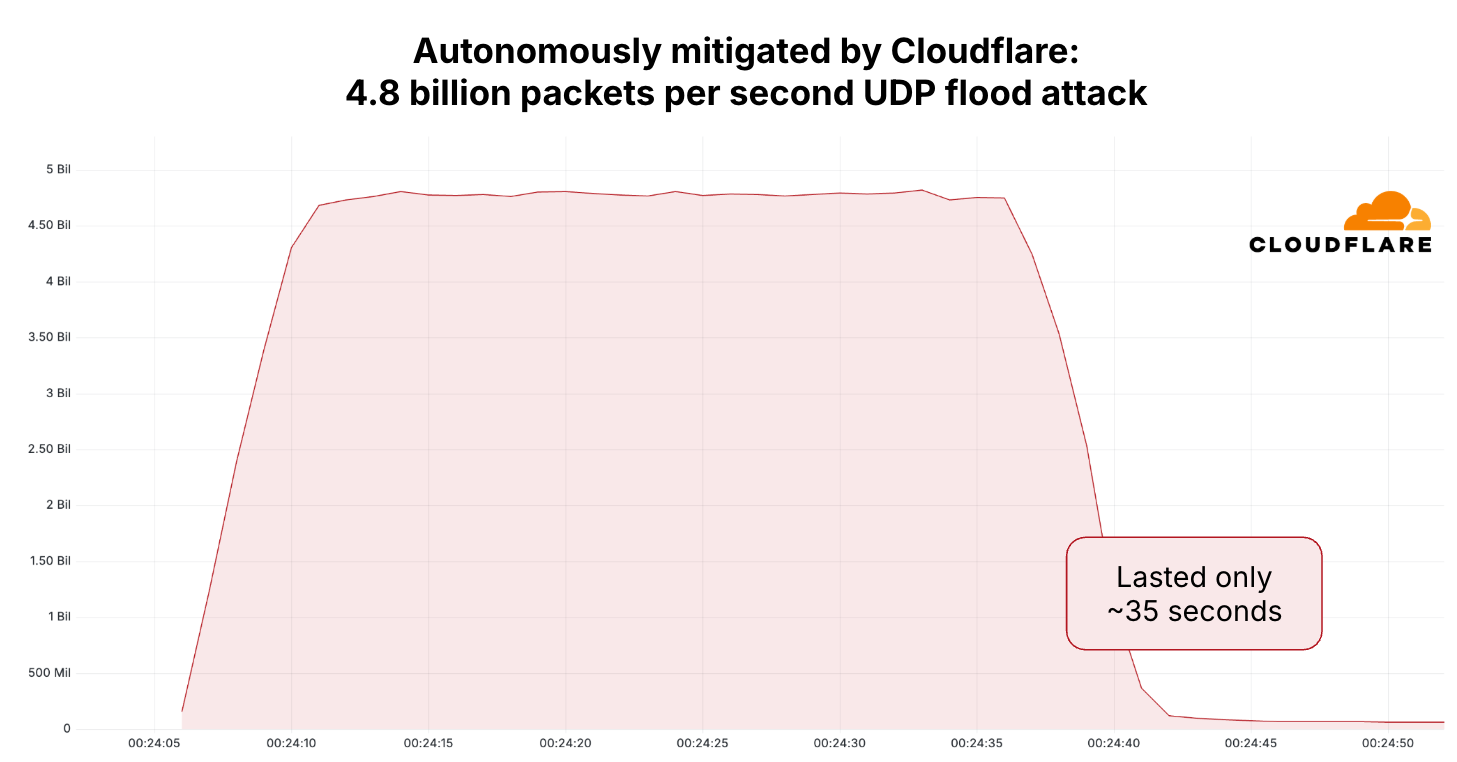
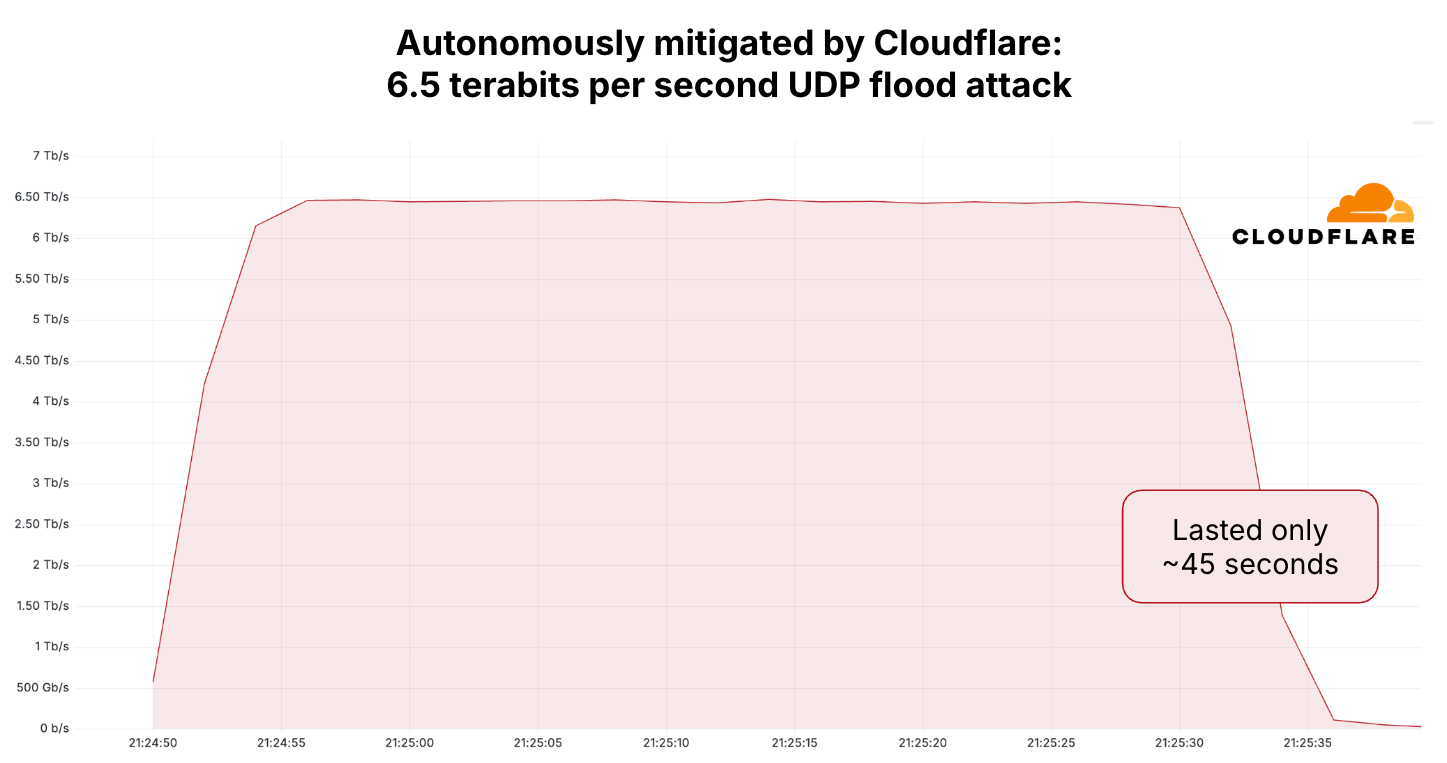
Record-Breaking Attacks: We blocked the most intense packet rate attack on record, peaking at 4.8 billion packets per second (Bpps), 52% higher than the previous benchmark, and separately defended against a massive 6.5 terabits-per-second (Tbps) flood, matching the highest bandwidth attacks ever reported.
Key DDoS Insights
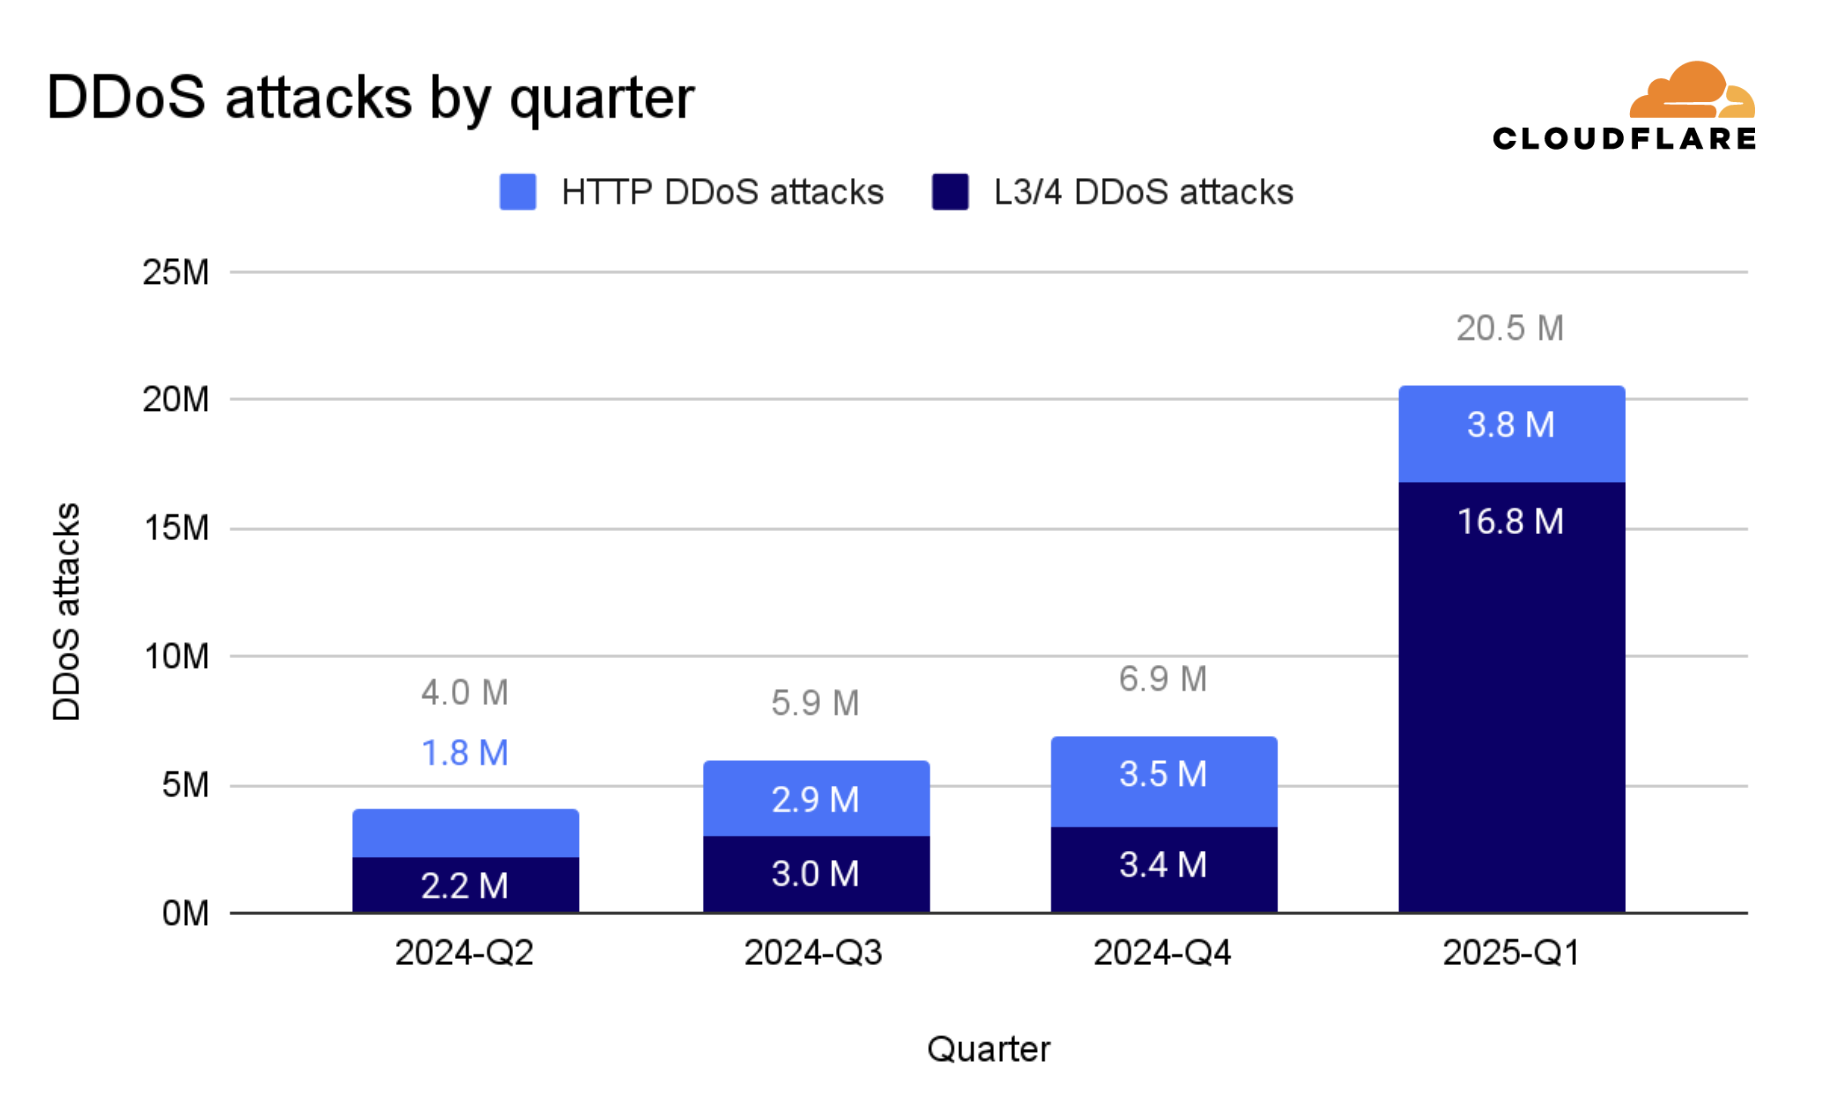
- In Q1 2025, Cloudflare blocked 20.5 million DDoS attacks - representing a 358% year-over-year increase and a 198% quarter-over-quarter increase.
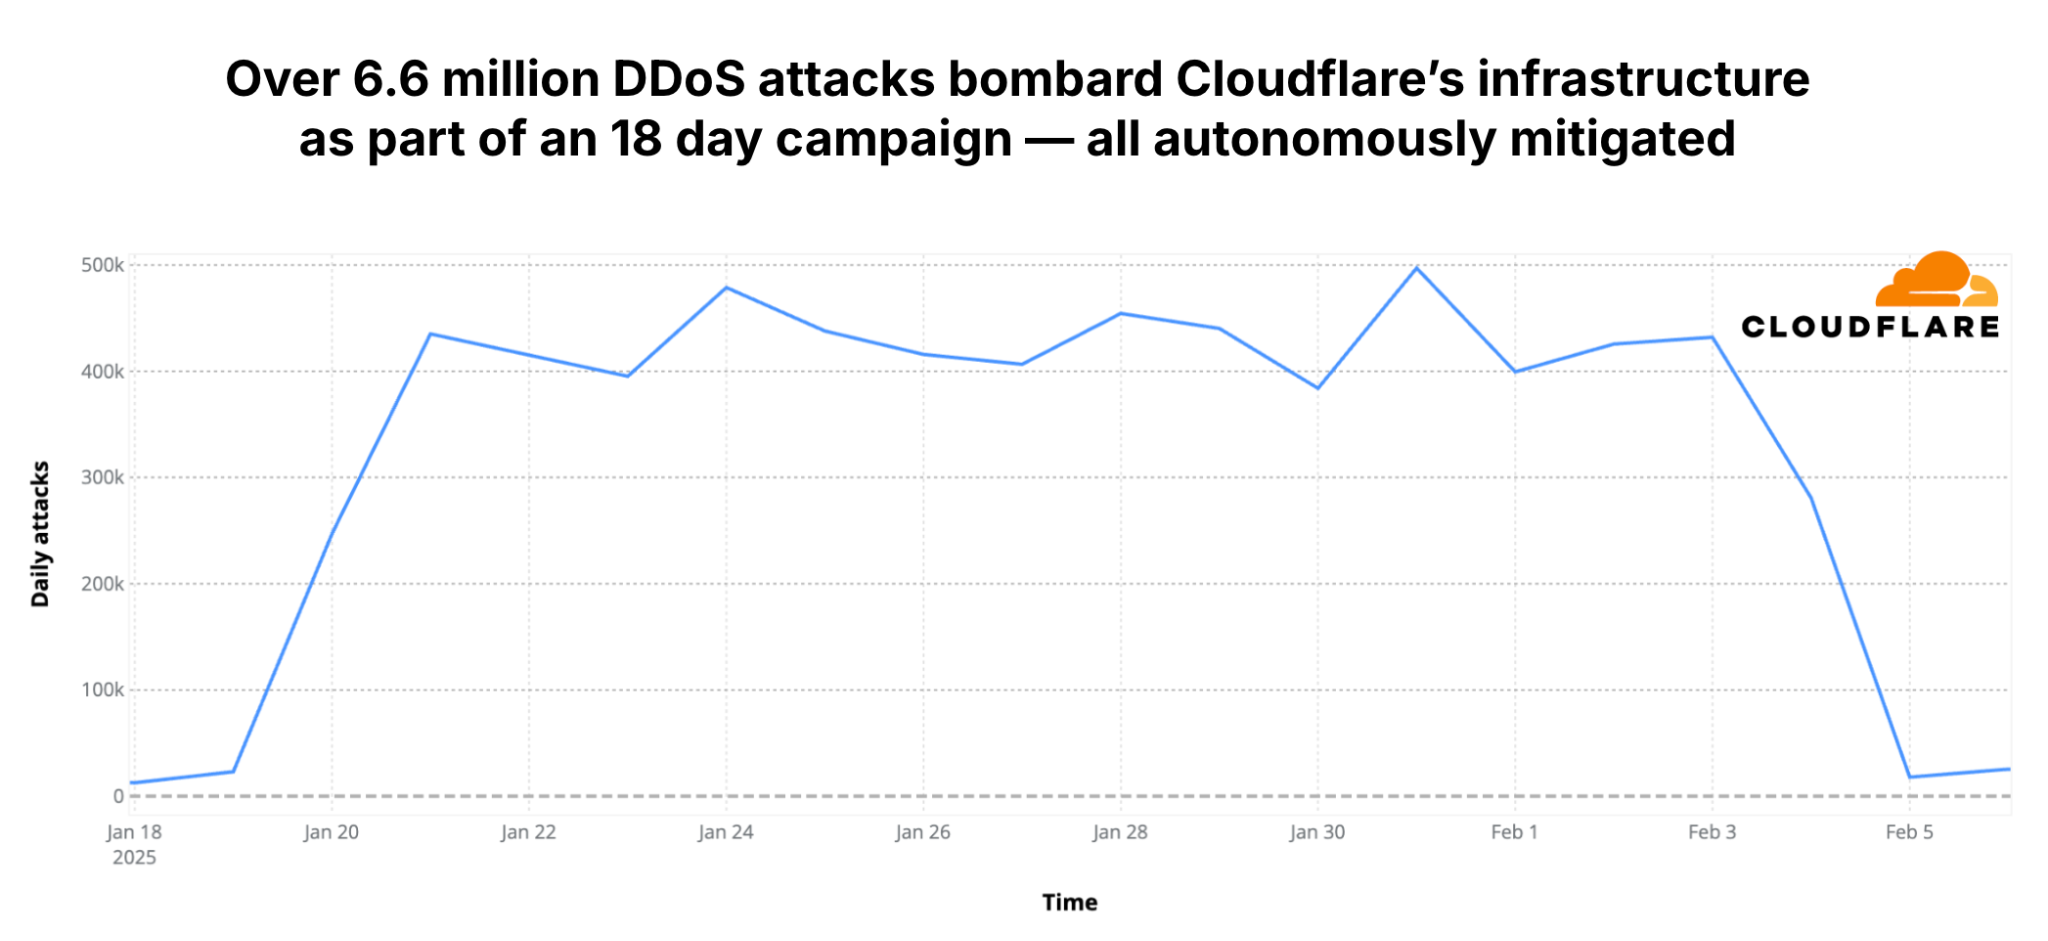
- 6.6 million attacks targeted Cloudflare's network infrastructure directly, as part of an 18-day multi-vector attack campaign.
- Approximately 700 hyper-volumetric DDoS attacks exceeded 1 Tbps or 1 Bpps - an average of around 8 attacks per day.
- All attacks were blocked by Cloudflare's autonomous defenses.
DDoS Attacks in Numbers
In Q1 2025, we blocked 20.5 million DDoS attacks. For comparison, during the calendar year 2024, we blocked 21.3 million DDoS attacks. In just this past quarter, we blocked 96% of what we blocked in all of 2024.
Attacks Targeting Cloudflare and Internet Infrastructure
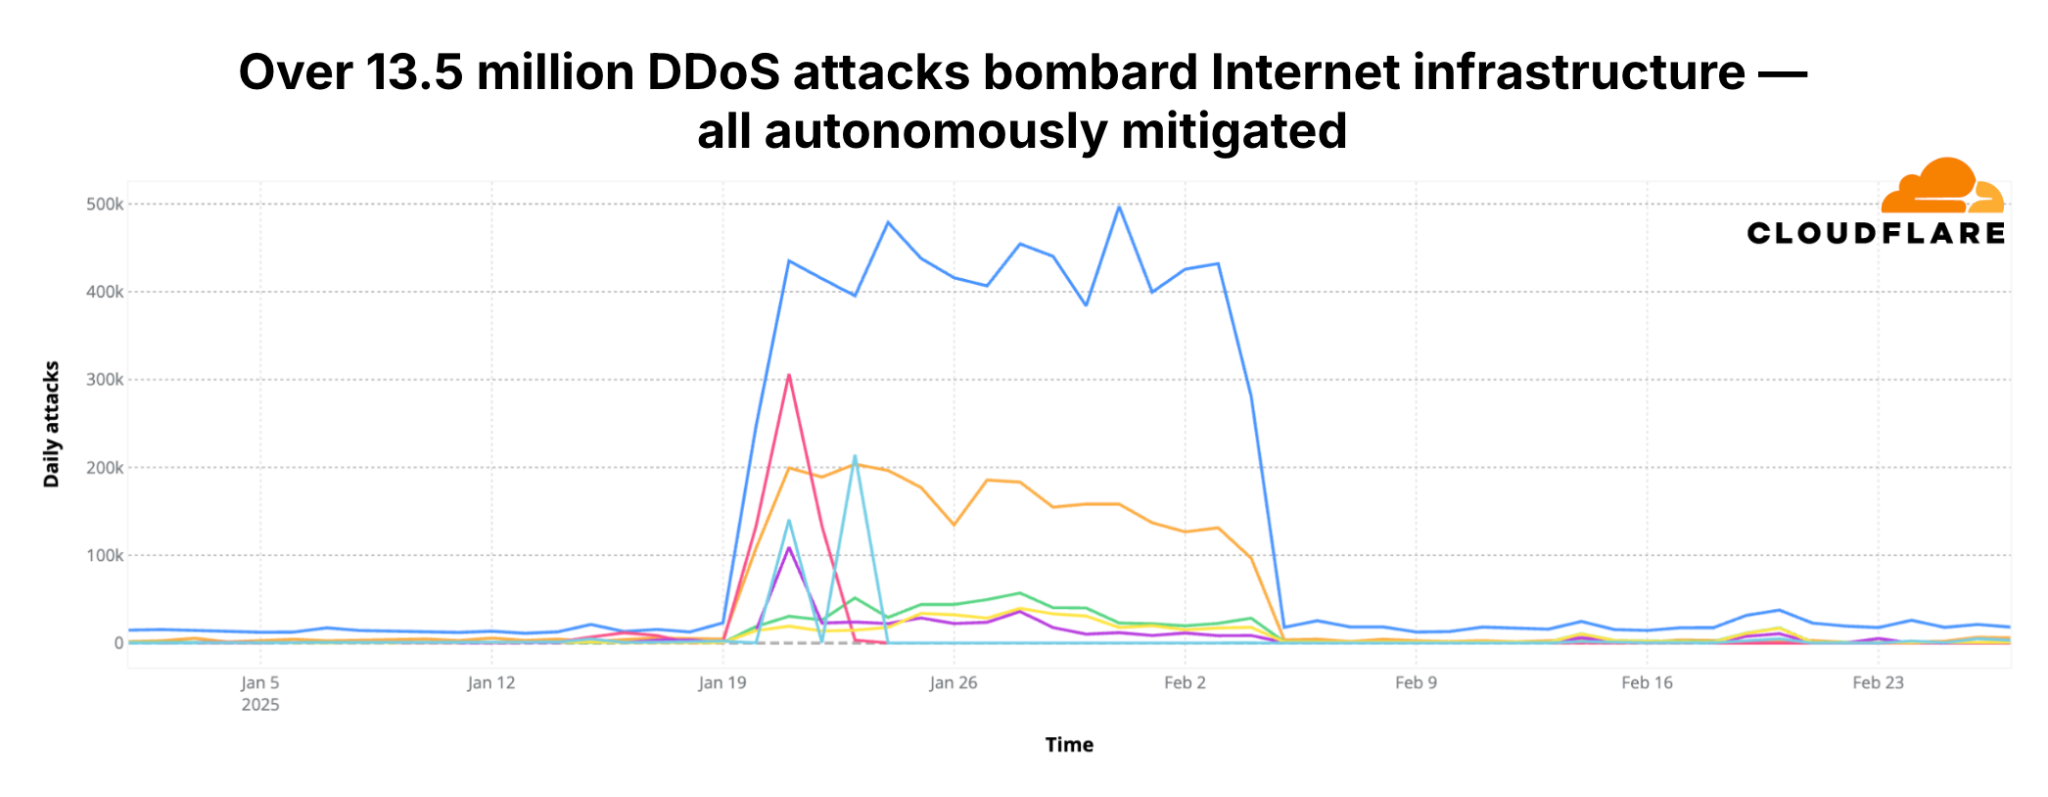
Of the 20.5 million DDoS attacks blocked in Q1, 16.8 million were network-layer DDoS attacks, and of those, 6.6M targeted Cloudflare's network infrastructure directly. Another 6.9 million targeted hosting providers and service providers protected by Cloudflare.
Hyper-volumetric DDoS Attacks
Hyper-volumetric DDoS attacks are attacks that exceed 1-2 Tbps or 1 Bpps. In Q1 2025, we blocked over 700 of these attacks. Approximately 4 out of every 100,000 network-layer DDoS attacks were hyper-volumetric.
Record-Breaking Attacks Continue into Q2
In the second half of April 2025, Cloudflare's systems automatically detected and blocked dozens of hyper-volumetric DDoS attacks. The largest attacks peaked at 4.8 Bpps and 6.5 Tbps, with massive surges typically lasting between 35 and 45 seconds.
The attacks originated from 147 countries and targeted multiple IP addresses and ports of a hosting provider protected by Cloudflare Magic Transit. All attacks were successfully blocked.
Threat Actors
When surveying Cloudflare customers targeted by DDoS attacks, the majority said they didn't know who attacked them. Those who did know reported their competitors as the number one threat actor (39%).
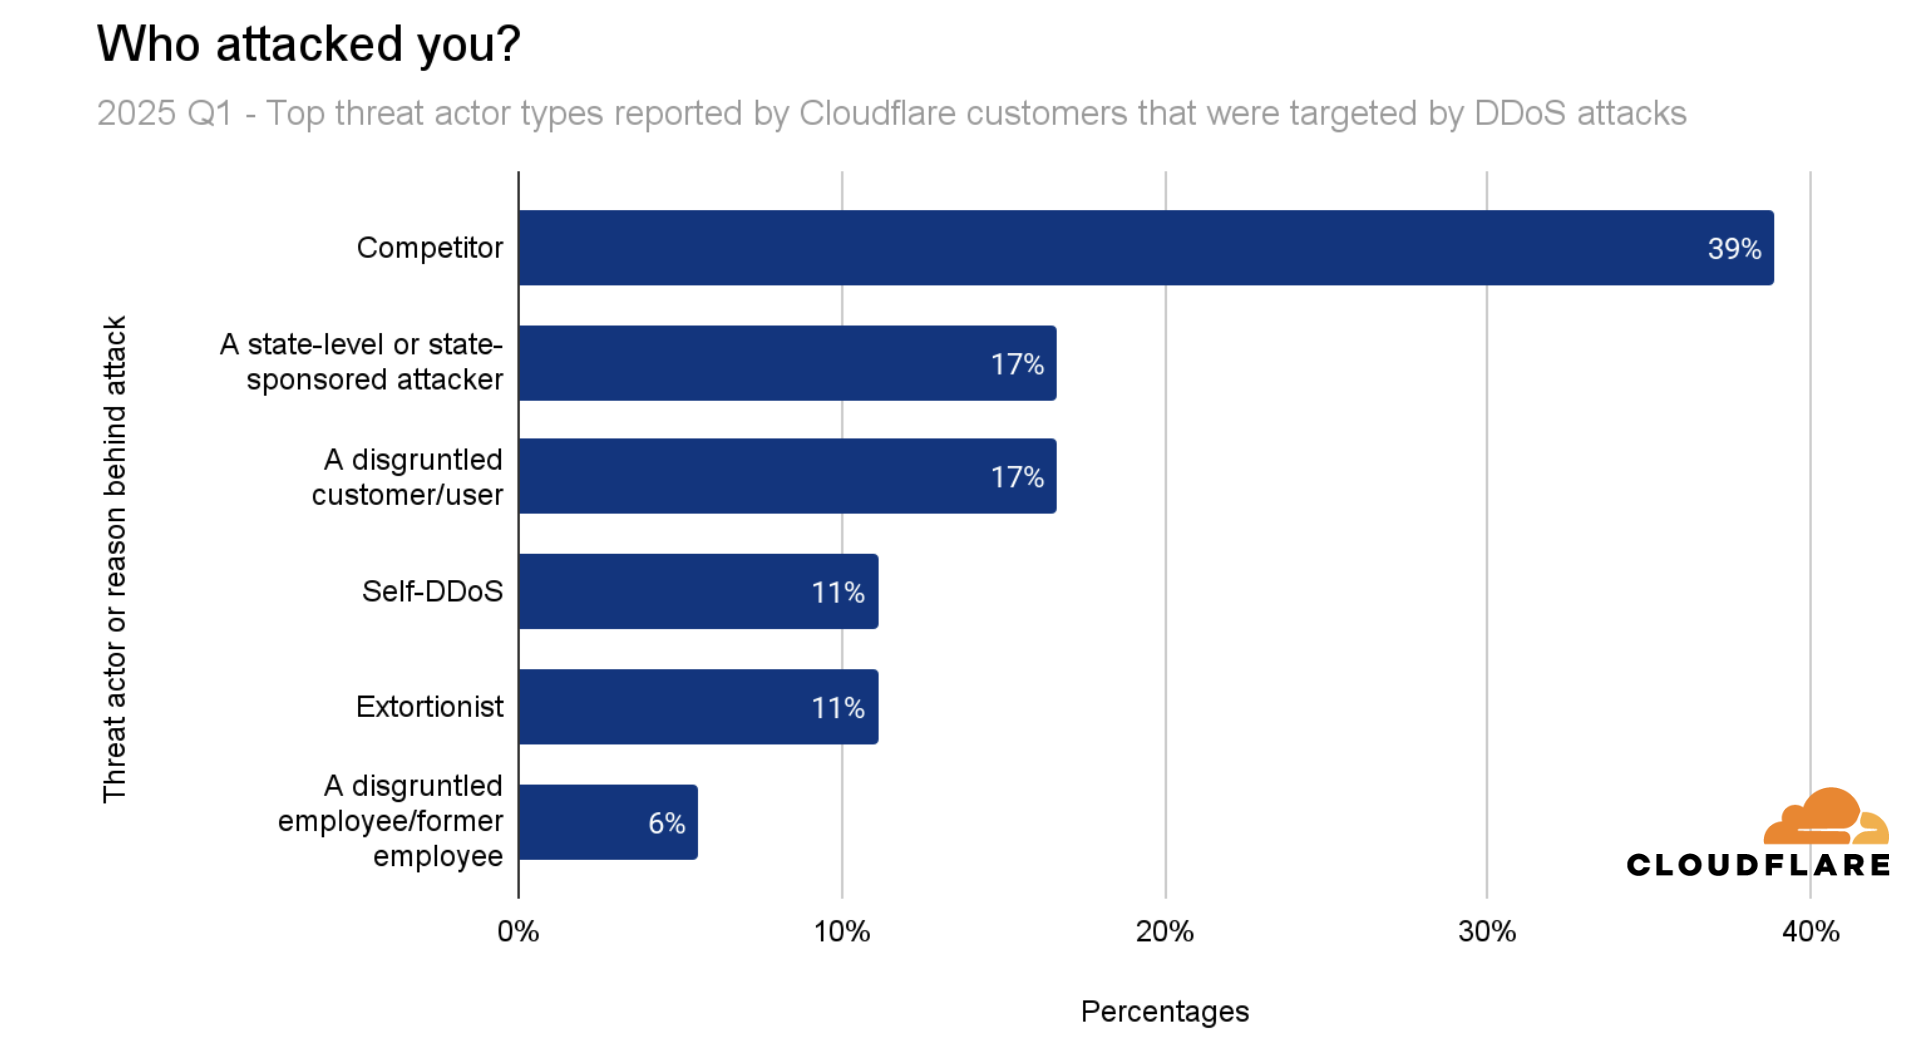
Threat Actor Breakdown
Anatomy of a DDoS Attack
Network-Layer Attack Vectors (L3/4)
SYN flood remains the most common Layer 3/4 DDoS attack vector, followed by DNS flood attacks. Mirai-launched DDoS attacks take third place, replacing UDP flood attacks.
Top L3/4 Attack Vectors
Application-Layer Attack Vectors (HTTP)
Over 60% of HTTP attacks were identified and blocked as known botnets, 21% were attacks with suspicious HTTP attributes, and 10% were launched by botnets impersonating browsers.
Top HTTP DDoS Attack Vectors
| Attack Vector | Share | Description |
|---|---|---|
| Known DDoS Botnets | 60.4% | Identified botnet signatures |
| Suspicious HTTP Attributes | 20.8% | Unusual request patterns |
| Fake/Headless Browsers | 10.0% | Browser impersonation attacks |
| Generic Floods | 6.9% | High-volume request floods |
| Unusual Requests | 1.2% | Anomalous request patterns |
| Cache Busting | 0.5% | Bypass caching mechanisms |
Emerging Threats
CLDAP Reflection/Amplification: We saw a 3,488% QoQ increase in CLDAP attacks. CLDAP (Connectionless Lightweight Directory Access Protocol) uses UDP instead of TCP, allowing attackers to spoof source IP addresses and exploit it as a reflection vector.
ESP Reflection/Amplification: A 2,301% QoQ increase in ESP (Encapsulating Security Payload) attacks. ESP is part of IPsec and can be abused in DDoS attacks if malicious actors exploit misconfigured systems.
Attack Size & Duration
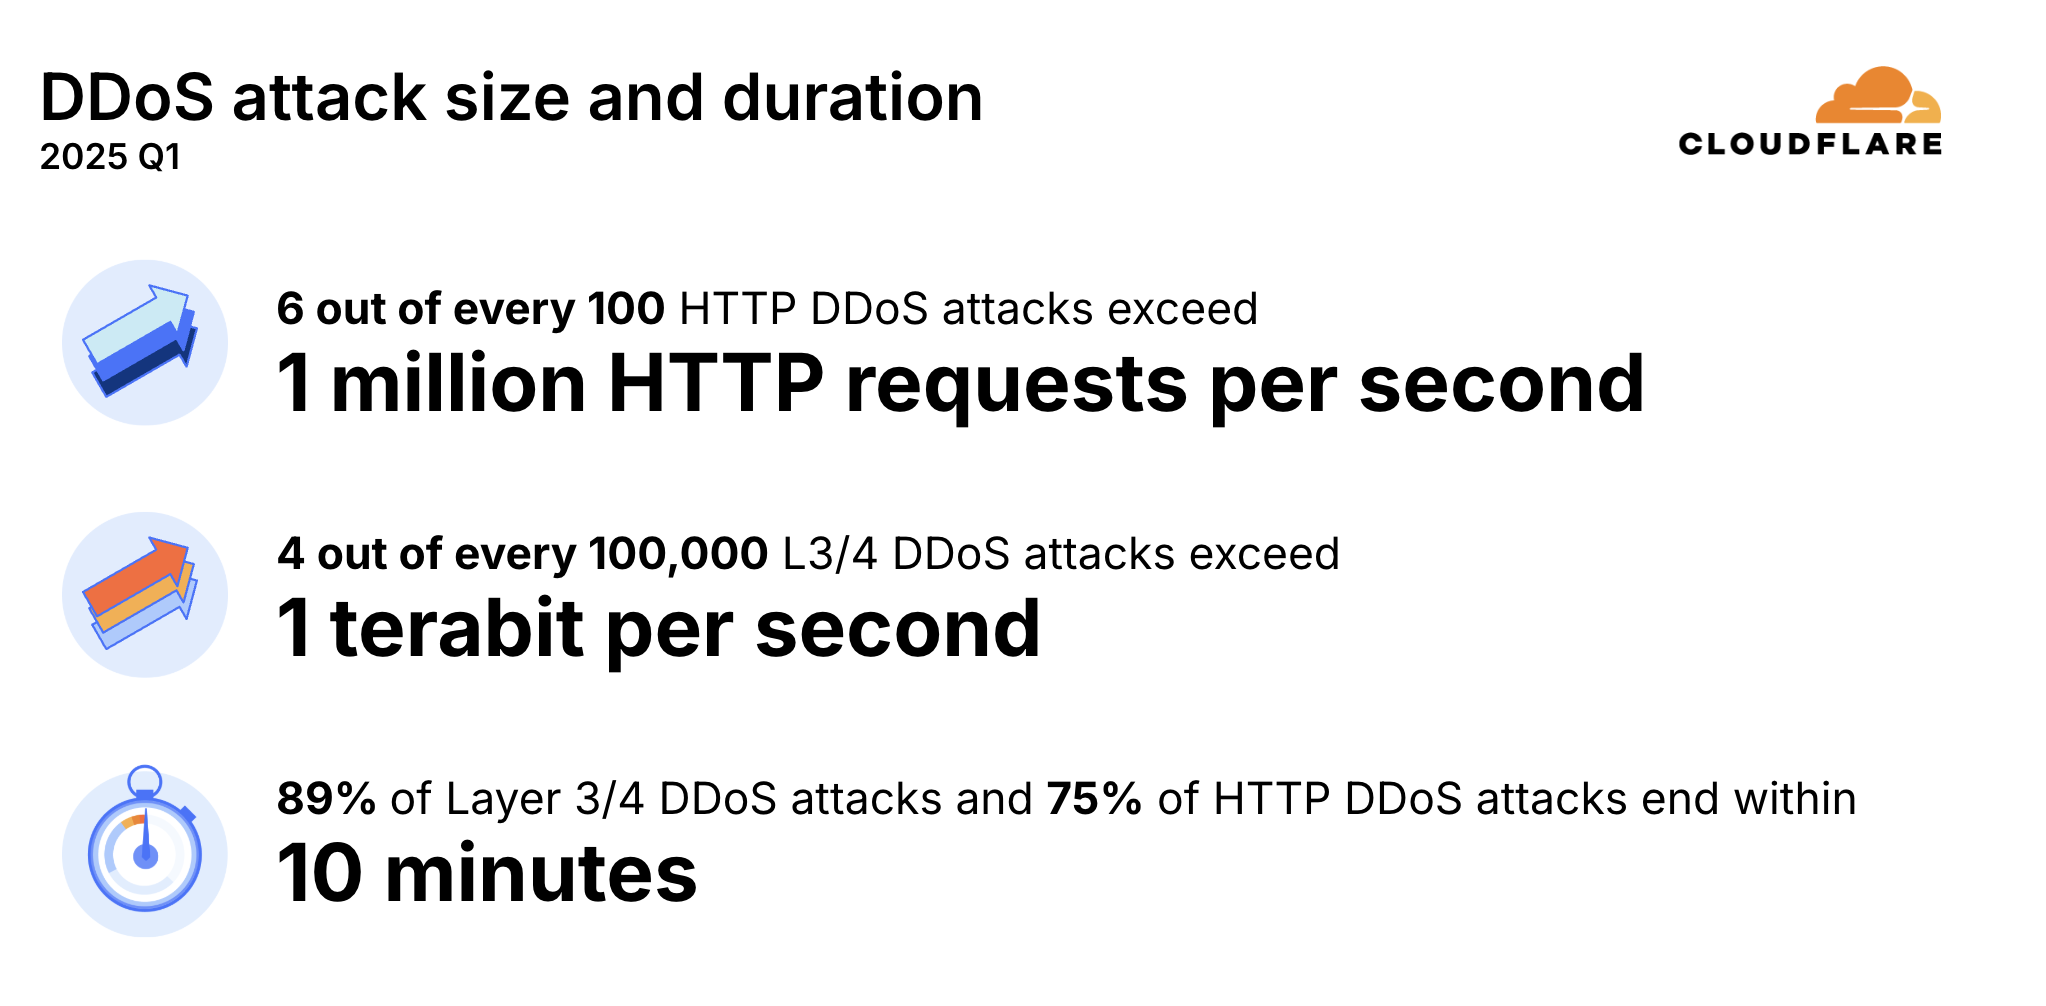
Despite the increase in hyper-volumetric attacks, most DDoS attacks are small. However, even "small" attacks can easily saturate unprotected Internet links and crash unprotected servers.
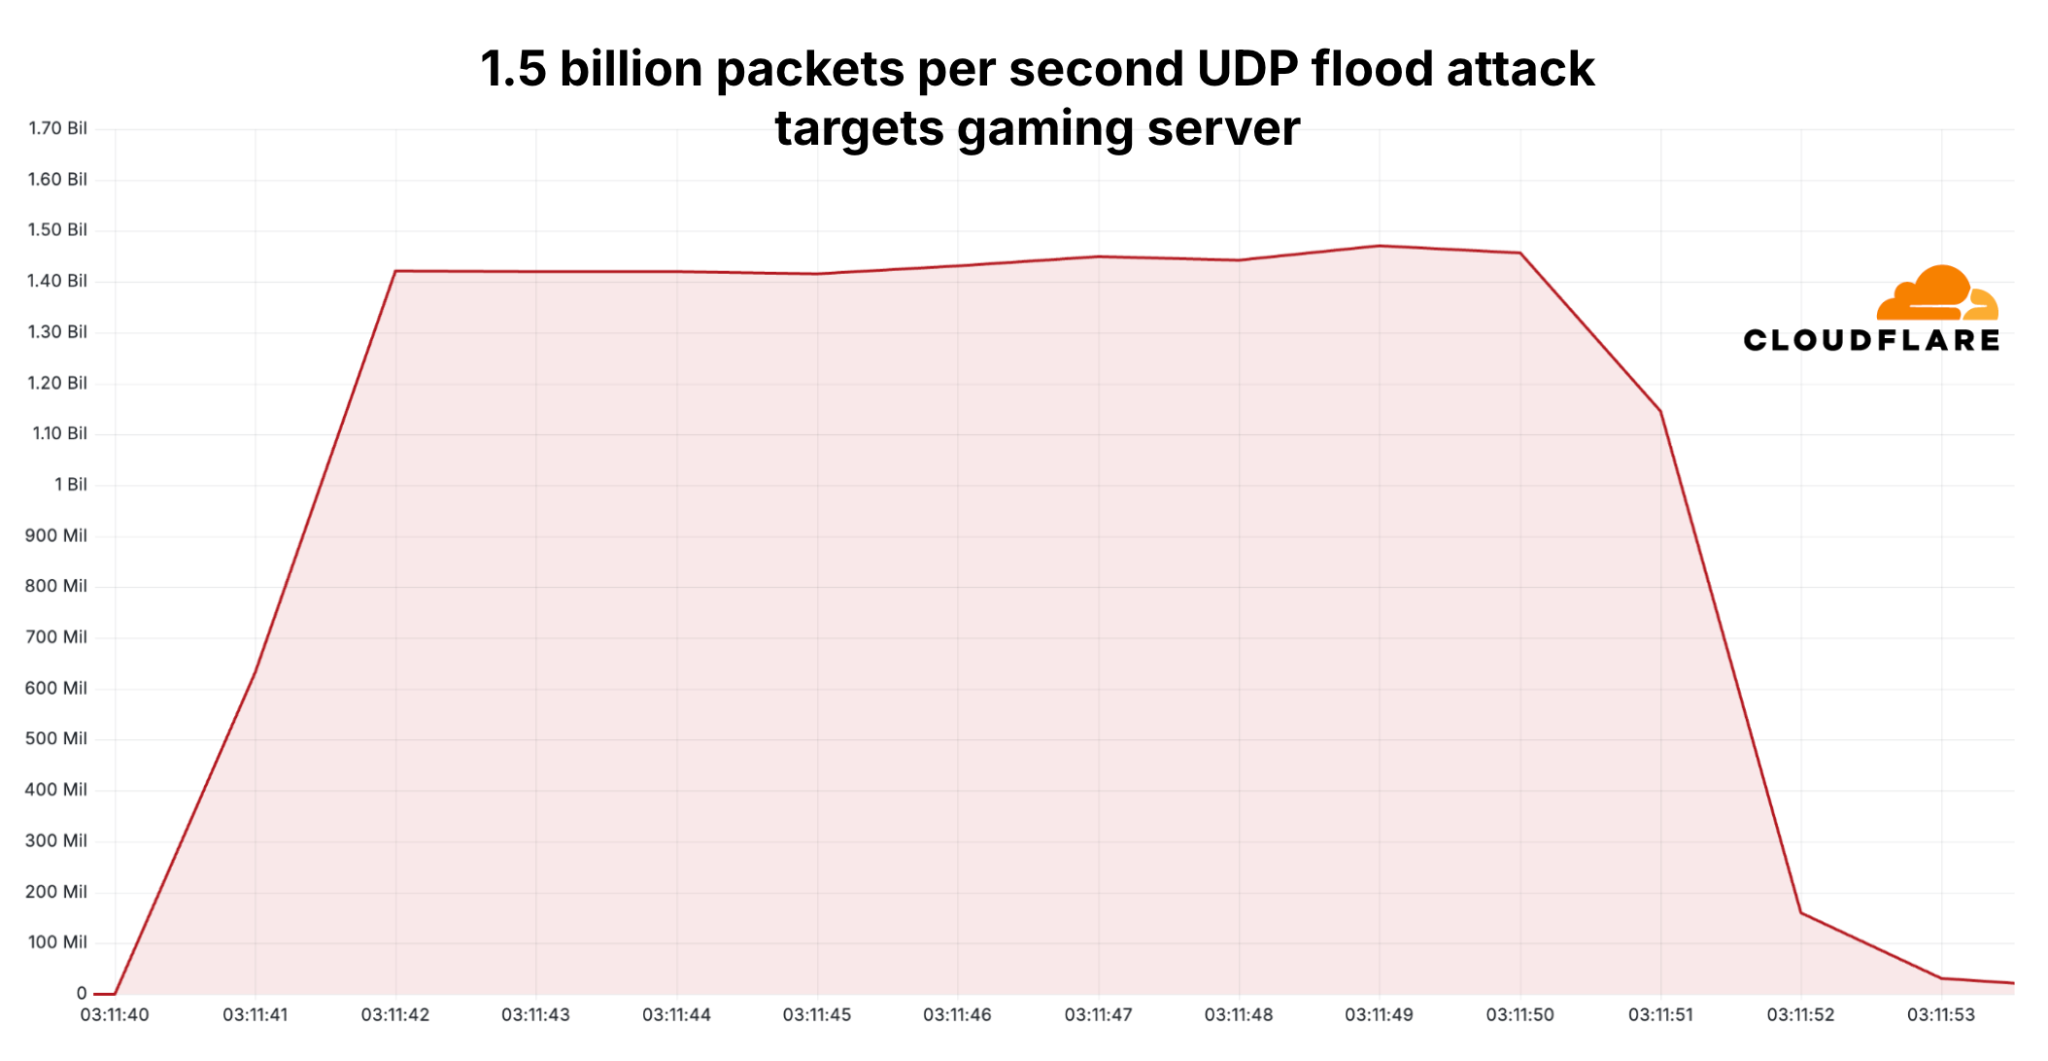
Attack Example: Gaming Server Target
One attack targeted a US-based hosting provider's game server on port 27015 (commonly used for Valve's Source engine games like CS:GO, Team Fortress 2, and Garry's Mod).
Top Attacked Locations
Attacked Countries and Regions
2025 Q1Hover over countries to see detailed DDoS attack statistics for both network-layer and application-layer attacks.
Hold Ctrl (or Cmd on Mac) + scroll to zoom, drag to pan
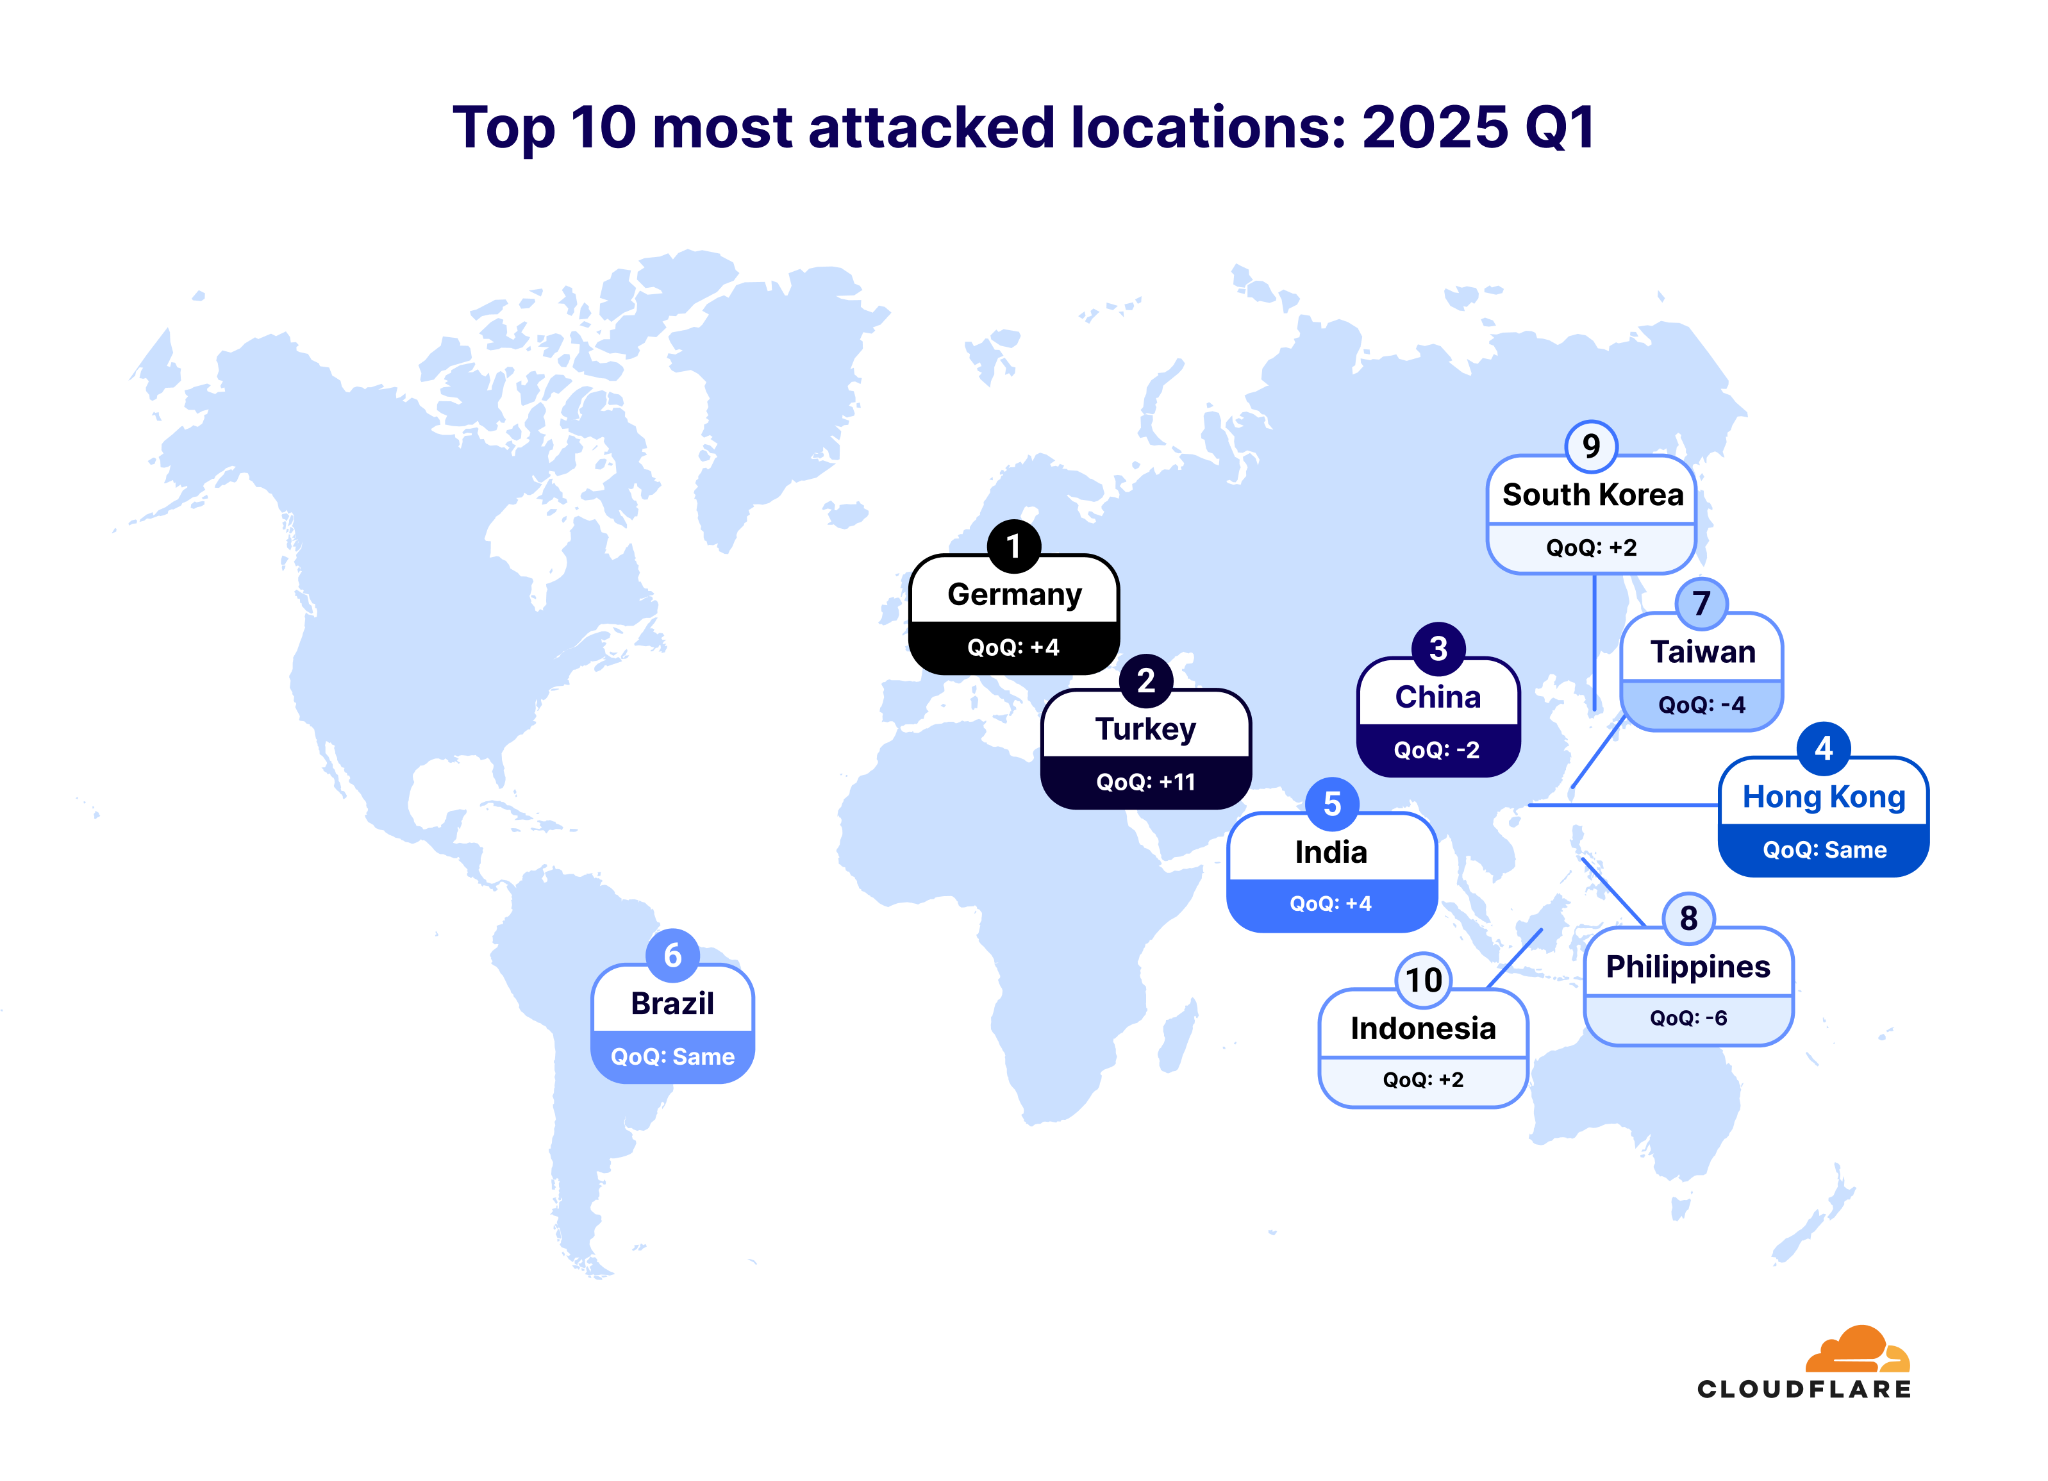
Most Attacked Countries - 2025 Q1
| Rank | Country | QoQ Change |
|---|---|---|
| 1 | Germany | +4 |
| 2 | Turkey | +11 |
| 3 | China | -2 |
| 4 | Hong Kong | Same |
| 5 | India | +4 |
| 6 | Brazil | Same |
| 7 | Taiwan | -4 |
| 8 | Philippines | -6 |
| 9 | South Korea | +2 |
| 10 | Indonesia | +2 |
Top Attacked Industries
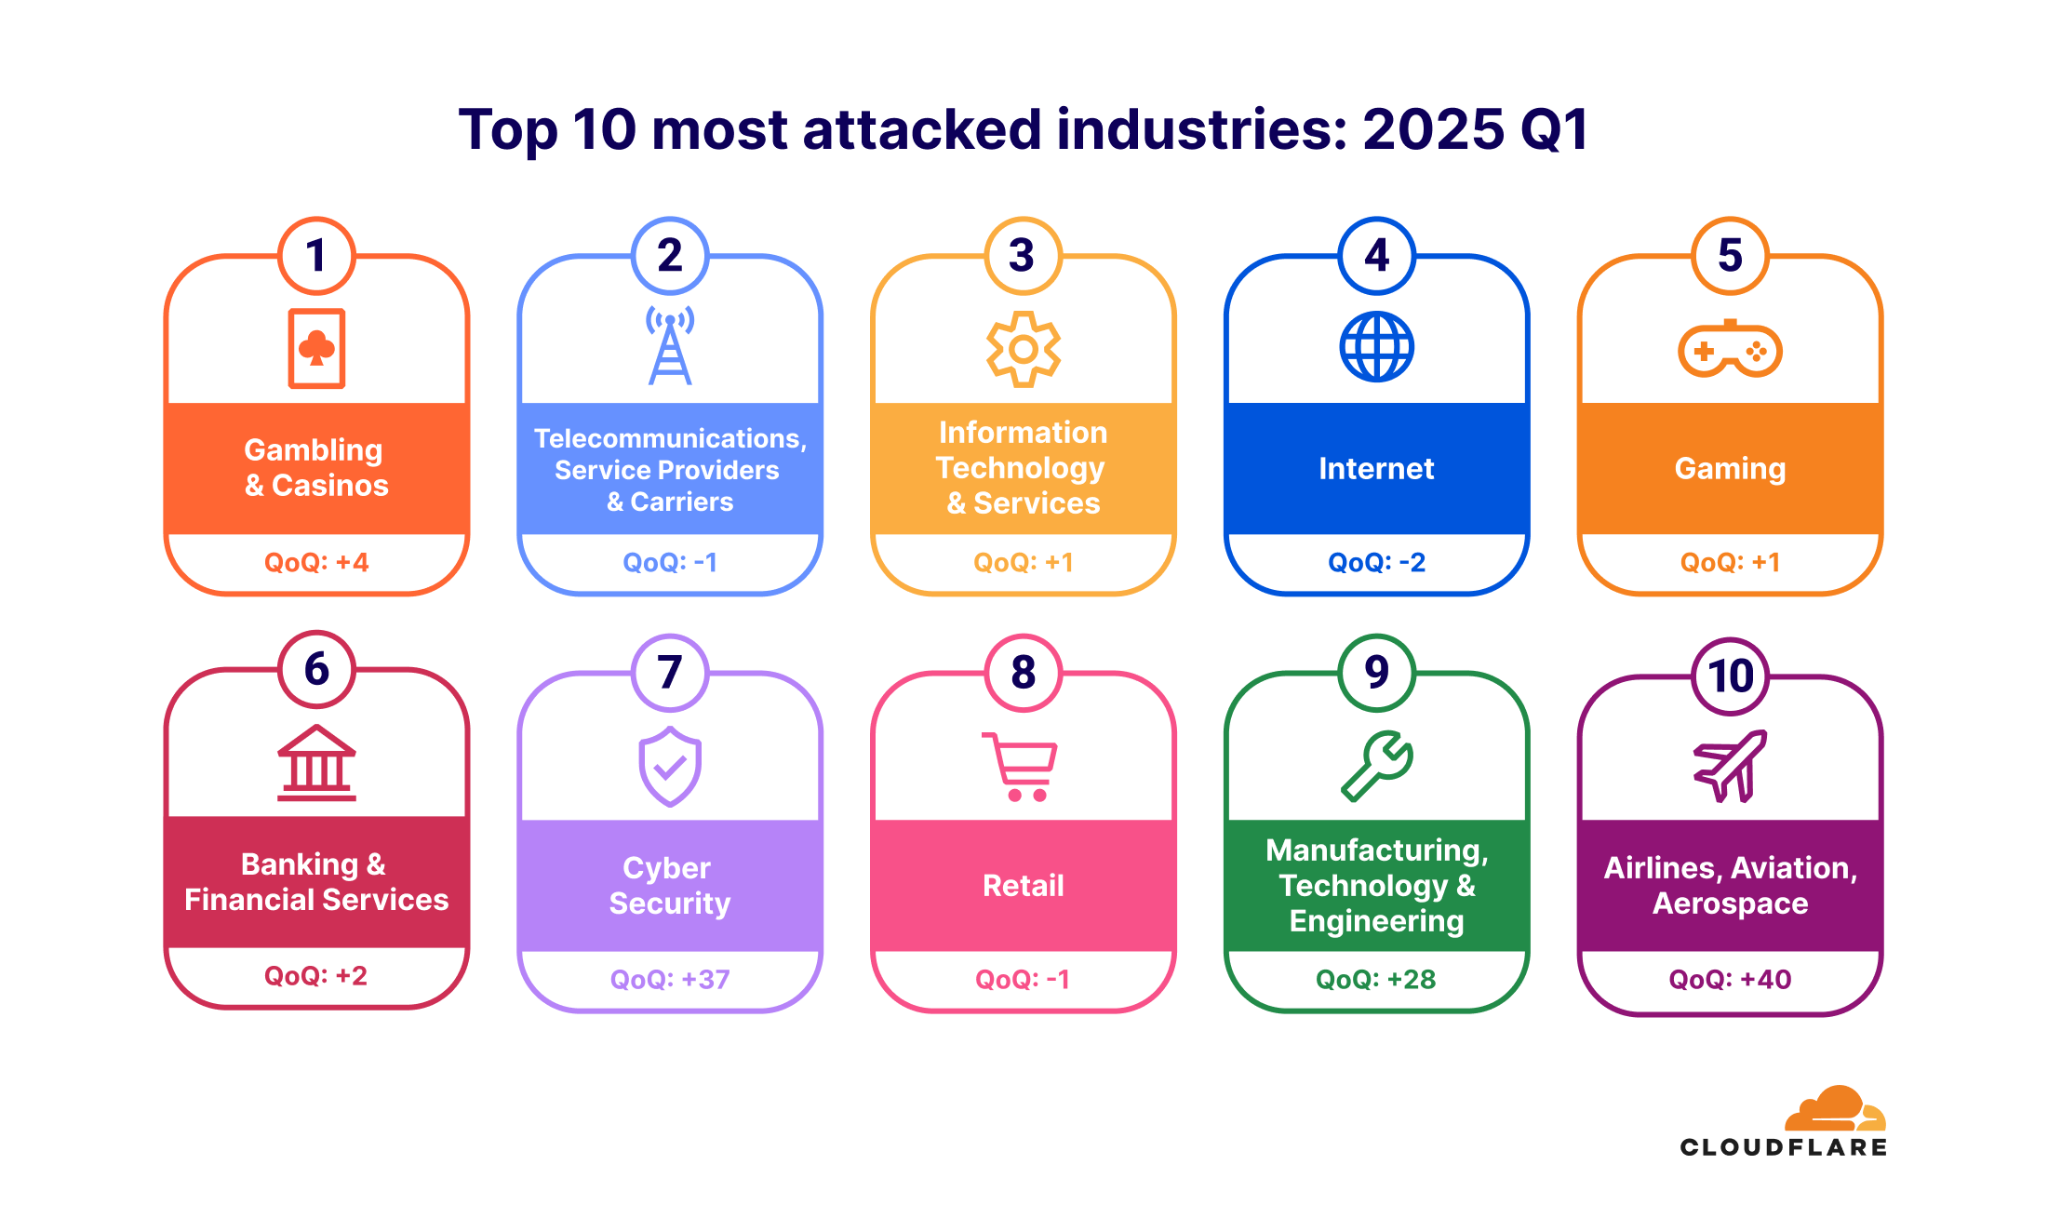
Most Attacked Industries - 2025 Q1
| Rank | Industry | QoQ Change |
|---|---|---|
| 1 | Gambling & Casinos | +4 |
| 2 | Telecommunications, Service Providers & Carriers | -1 |
| 3 | Information Technology & Services | +1 |
| 4 | Internet | -2 |
| 5 | Gaming | +1 |
| 6 | Banking & Financial Services | +2 |
| 7 | Cyber Security | +37 |
| 8 | Retail | -1 |
| 9 | Manufacturing, Technology & Engineering | +28 |
| 10 | Airlines, Aviation & Aerospace | +40 |
Top Attack Sources
Sources of DDoS Attacks
2025 Q1Hover over countries to see detailed statistics about DDoS attack origins.
Hold Ctrl (or Cmd on Mac) + scroll to zoom, drag to pan
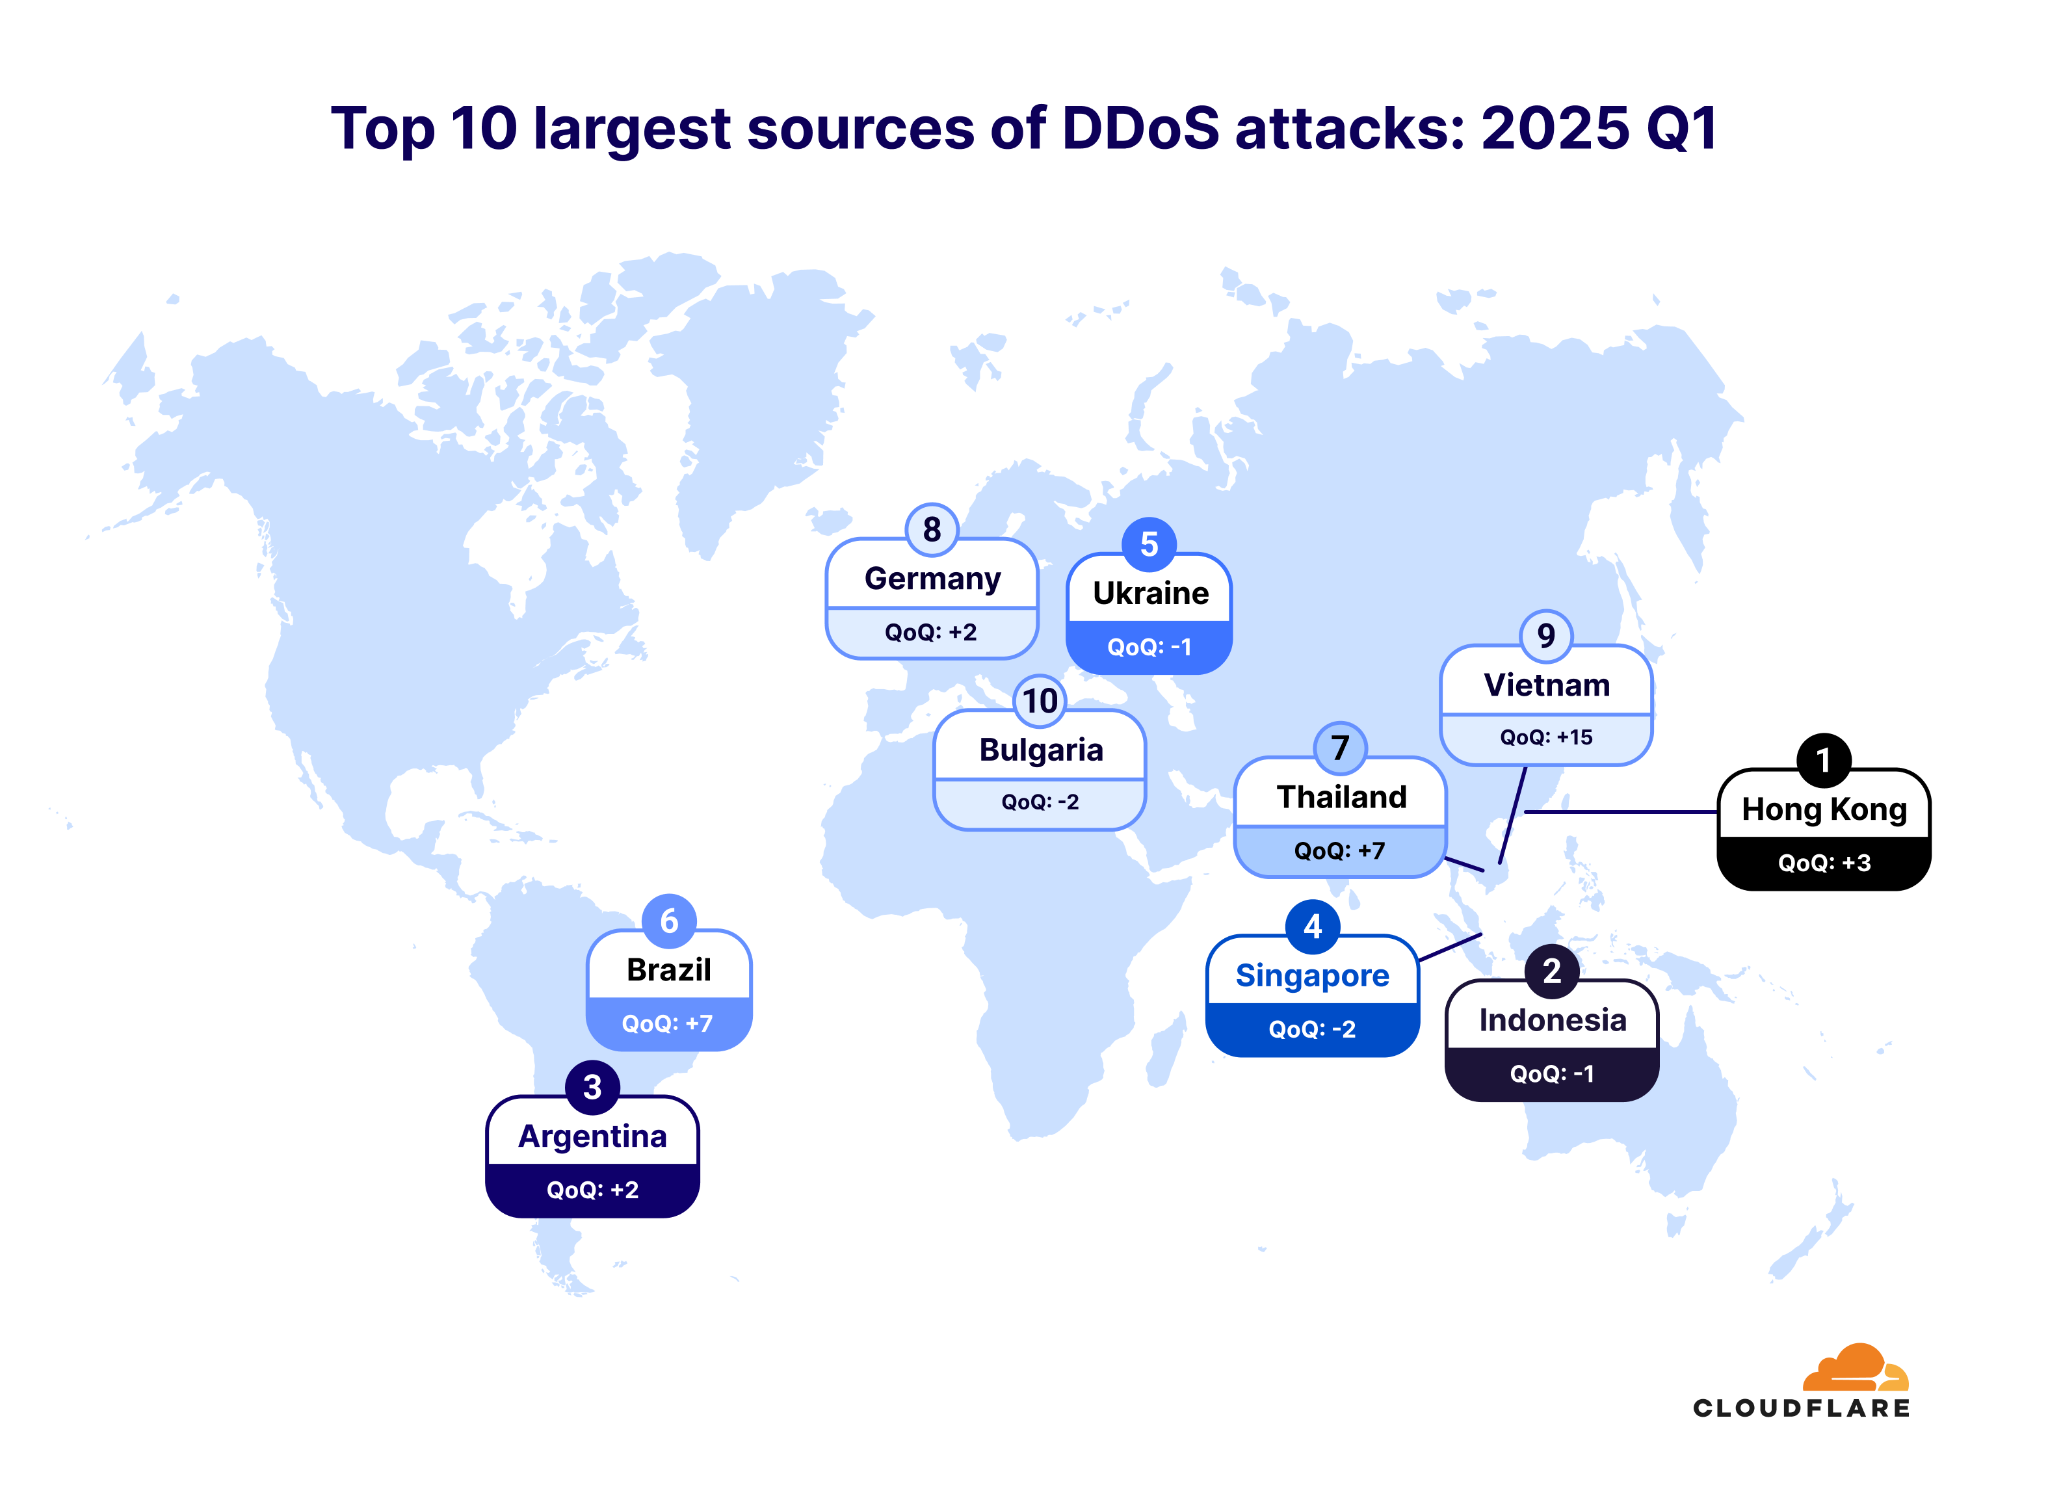
Largest Attack Sources by Country - 2025 Q1
| Rank | Country | QoQ Change |
|---|---|---|
| 1 | Hong Kong | +3 |
| 2 | Indonesia | -1 |
| 3 | Argentina | +2 |
| 4 | Singapore | -2 |
| 5 | Ukraine | -1 |
| 6 | Brazil | +7 |
| 7 | Thailand | +7 |
| 8 | Germany | +2 |
| 9 | Vietnam | +15 |
| 10 | Bulgaria | -2 |
Top Source ASNs (HTTP DDoS Attacks)
Most of the networks in this ranking are well-known cloud computing or hosting providers, highlighting how cloud infrastructure is frequently leveraged for launching DDoS attacks.
Top 10 Source ASNs
| Rank | ASN | Name | Share |
|---|---|---|---|
| 1 | AS24940 | Hetzner (Germany) | 3.53% |
| 2 | AS16276 | OVH (France) | 2.65% |
| 3 | AS14061 | DigitalOcean (US) | 2.64% |
| 4 | AS51167 | Contabo (Germany) | 2.61% |
| 5 | AS4134 | ChinaNet Backbone (China) | 2.21% |
| 6 | AS132203 | Tencent (China) | 2.15% |
| 7 | AS200373 | Drei (Austria) | 2.08% |
| 8 | AS8075 | Microsoft (US) | 1.99% |
| 9 | AS31898 | Oracle (US) | 1.64% |
| 10 | AS396982 | Google Cloud Platform (US) | 1.61% |
Free DDoS Botnet Threat Feed: Cloudflare offers a free DDoS Botnet Threat Feed for Service Providers to help identify and take down abusive accounts. Over 600 organizations worldwide have already signed up.
Helping Build a Better Internet
At Cloudflare, our mission is to help build a better Internet. A key part of that commitment is offering free protection against DDoS attacks, as well as supporting the broader Internet community by providing free tools to help other networks detect and dismantle botnets operating within their infrastructure.
Backed by our global network with 348 Tbps of capacity spanning 335 cities, we remain dedicated to delivering unmetered, unlimited DDoS protection, regardless of the size, duration, or frequency of attacks.
Data Source: Cloudflare Radar | For more details, visit www.ddosreport.com
To learn more about DDoS attacks and other types of cyber threats, refer to the Cloudflare Learning Center.